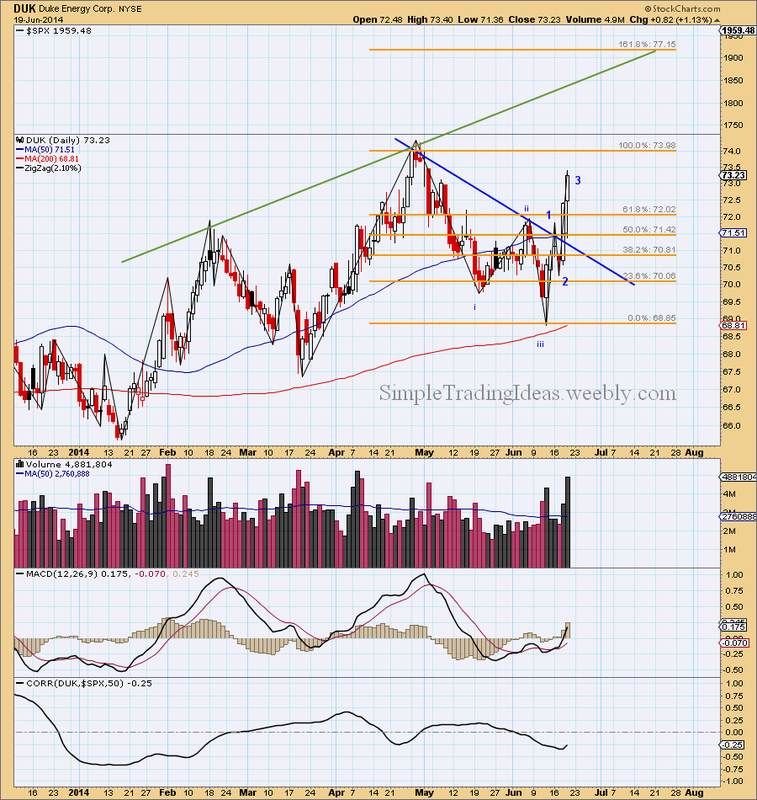
Duke Energy Corporation is a large-cap company with around 50 billion market cap. It has a low beta value and the correlation to the S&P 500 is not even close (as you can see in the indicator window below the daily chart), but this stock is not boring. Duke is moving in an uptrend, you can check it out on the weekly chart and it makes around 9-10% impulsive waves and around 6-7% corrective waves as it slowly advances higher. This company has good fundamentals too. All these make Duke a good candidate for swing trading. The daily chart below shows a recent trade setup using Elliott Waves with Fibonacci Levels. The stock completed a corrective wave right before the middle of June marked with i-ii-iii. The 200-day moving average provided support. Wave iii is shorter than wave i and this makes this setup even more bullish. The stock quickly started to move higher in wave 1 when the smart money started to buy. The green volume bar nicely broke above the average trading volume. Wave 2 followed wave 1 with a 50% retracement. This can be seen better on the Hourly chart, not shown here. On June 18, yesterday, the price broke thru the blue line which is the upper channel of the corrective downtrend and the stock advanced 2.40%. This is when the retail traders started to pile in. The volume bar confirms that too. The stock nicely advanced today too. So currently we are in wave 3. wave 3 has the potential to extend twice as long as wave 1 or even more. Using Fibonacci levels and the upper channel (green line) I am estimating how far this move can extend. If I want to be more conservative I set the target to the 123.6-138.2% level or the 150% level. Of course there will be some red candles on the way up to the target and also a wave 4 which will probably be shallow.

 RSS Feed
